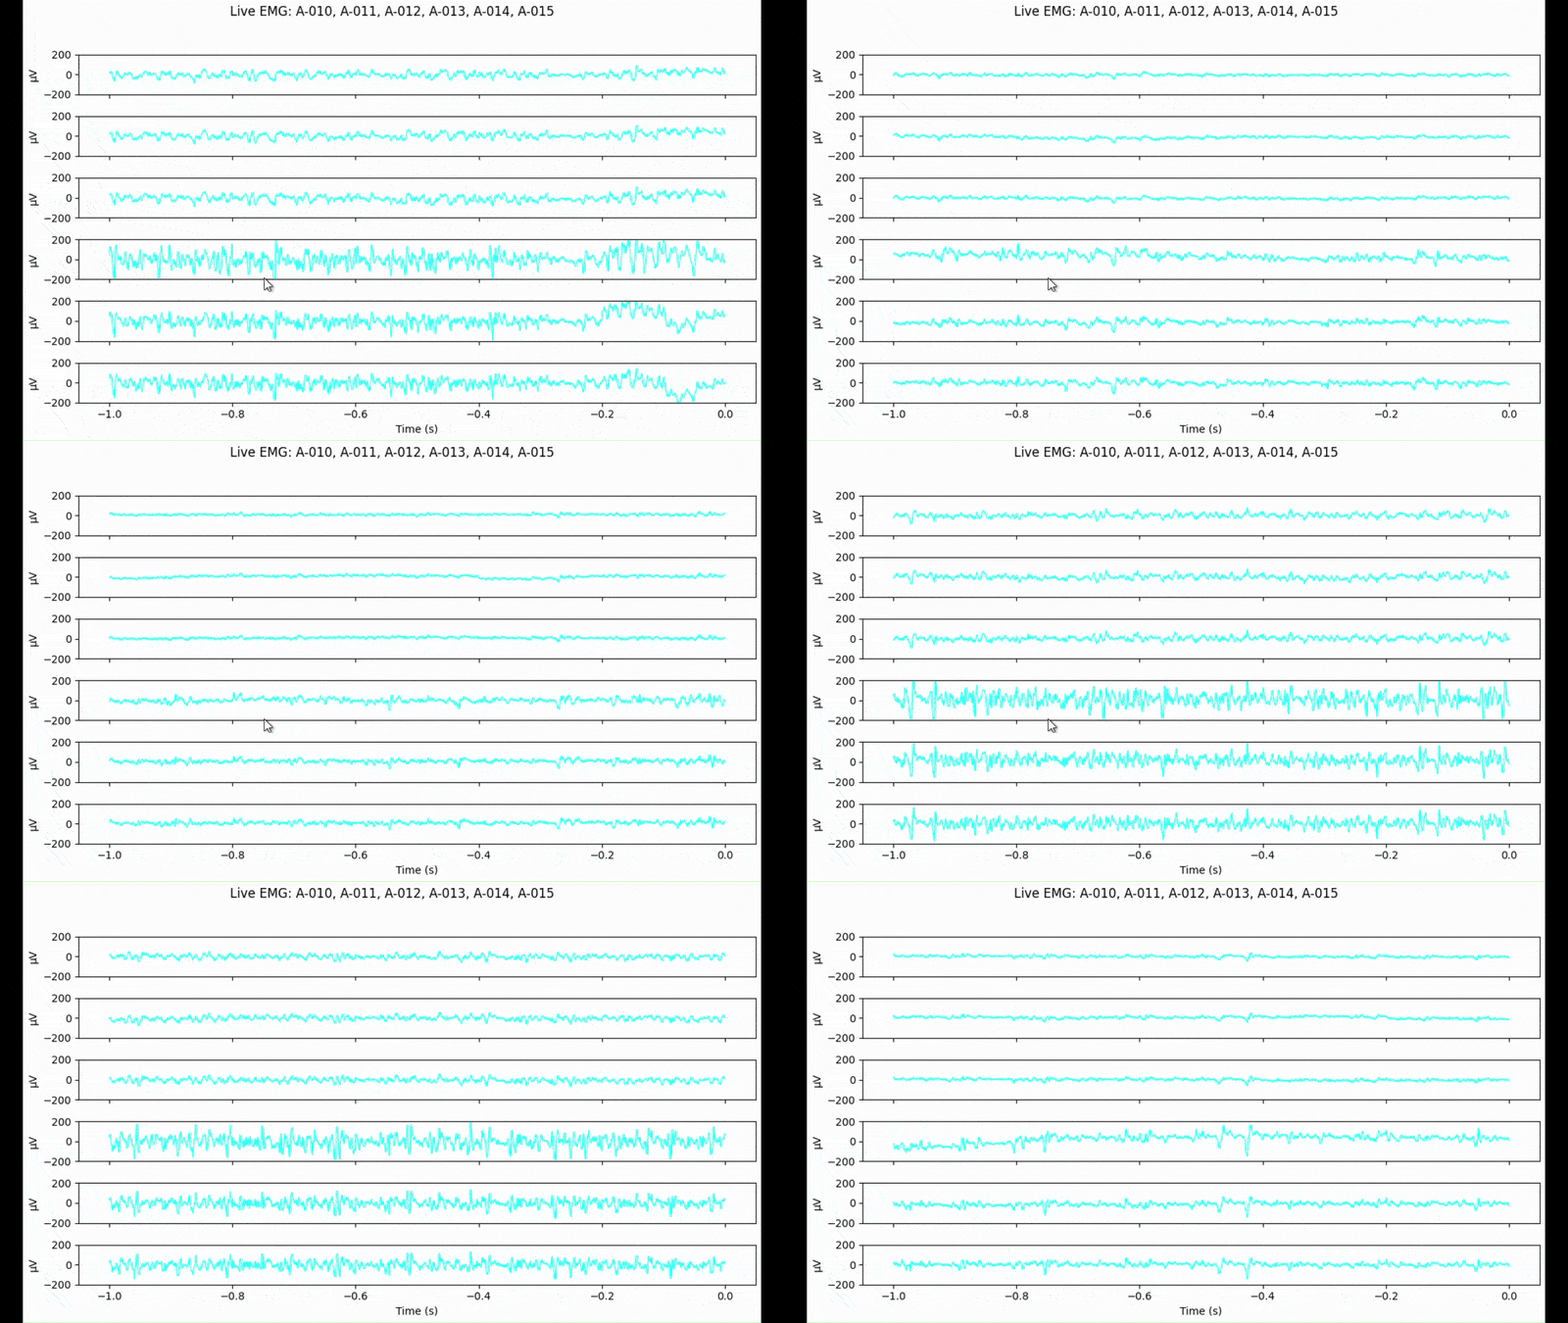
Live Plotting of Multiple EMG Channels
This example demonstrates how to visualize live EMG data from multiple channels using the RHX device and Matplotlib’s animation features.

Requirements:
Intan RHX Controller with TCP servers enabled (Remote Control)
matplotlib (with Qt5Agg backend; pip install matplotlib pyqt5)
matplotlib (with Qt5Agg backend). Install GUI dependencies with:
pip install 'python-intan[gui]'or manually:
pip install matplotlib PyQt5
A running RHX TCP server
You’ll see how to: - Connect to the RHX device over TCP - Stream EMG data from selected channels in real time - Display a scrolling plot for each channel in a shared window
Example code:
"""
Example: Live plotting of multiple EMG channels from an Intan RHX device.
Streams channels 10-15 and displays them in real time.
"""

import time
import numpy as np
import matplotlib
matplotlib.use("Qt5Agg")  # Use fast, responsive backend
import matplotlib.pyplot as plt
import matplotlib.animation as animation
from intan.interface import IntanRHXDevice

# === Configuration ===
CHANNELS = [10, 11, 12, 13, 14, 15]
SAMPLING_RATE = 4000
WINDOW_SEC = 1.0
PLOT_UPDATE_HZ = 5  # Refresh every 200 ms

SAMPLES_PER_WINDOW = int(SAMPLING_RATE * WINDOW_SEC)
PLOT_INTERVAL_SEC = 1 / PLOT_UPDATE_HZ
x_data = np.linspace(-WINDOW_SEC, 0, SAMPLES_PER_WINDOW)

# === Initialize RHX Device ===
device = IntanRHXDevice()
if not device.connected:
    raise RuntimeError("Could not connect to RHX TCP server. Make sure it's running.")
device.configure(channels=CHANNELS, blocks_per_write=1, enable_wide=True)

# === Setup Plotting ===
fig, axs = plt.subplots(len(CHANNELS), 1, figsize=(10, 6), sharex=True)
axs = np.atleast_1d(axs)
lines = {}
buffers = {}

for ax, ch in zip(axs, CHANNELS):
    ax.set_ylabel("µV")
    ax.set_ylim(-200, 200)
    ax.grid(False)
    ax.set_title("")
    ax.legend().set_visible(False)

    line, = ax.plot(x_data, np.zeros(SAMPLES_PER_WINDOW), label=f"A-{ch:03d}", color="cyan", linewidth=1)
    lines[ch] = line
    buffers[ch] = np.zeros(SAMPLES_PER_WINDOW)

axs[-1].set_xlabel("Time (s)")
fig.suptitle("Live EMG: " + ", ".join([f"A-{ch:03d}" for ch in CHANNELS]))
fig.tight_layout(rect=[0, 0, 1, 0.96])

# === Update Function ===
def update_plot(_):
    n_frames = int(SAMPLING_RATE * PLOT_INTERVAL_SEC)
    start_time = time.time()
    try:
        _, channel_array = device.stream(n_frames=n_frames)
    except Exception as e:
        print(f"[Stream Error] {e}")
        return lines.values()

    elapsed = time.time() - start_time
    for i, ch in enumerate(CHANNELS):
        new_data = channel_array[i]
        num_new = min(len(new_data), SAMPLES_PER_WINDOW)
        buffers[ch] = np.roll(buffers[ch], -num_new)
        buffers[ch][-num_new:] = new_data[-num_new:]
        lines[ch].set_ydata(buffers[ch])

    rate = channel_array.shape[1] / elapsed if elapsed > 0 else 0
    print(f"{channel_array.shape[1]} samples/ch in {elapsed:.3f} s → {rate:.1f} Hz")
    return lines.values()

# === Animation Loop ===
ani = animation.FuncAnimation(
    fig, update_plot,
    interval=int(PLOT_INTERVAL_SEC * 1000),
    blit=True
)

try:
    print(f"Streaming Channels: {', '.join([f'A-{ch:03d}' for ch in CHANNELS])}")
    plt.show()
except KeyboardInterrupt:
    print("Interrupted.")
finally:
    device.close()
    print("RHX device connection closed.")
Expected outcome:
Real-time, continuously updating plots for each selected channel
All channels appear in a single window stacked vertically
Streaming rate is printed in the terminal
Tips: - You can adjust the CHANNELS list to select different channels. - For a more responsive UI or to support additional features, see the PyQtGraph-based example in the next tutorial.
Troubleshooting:
- Make sure the Intan RHX TCP server is running and channels are enabled for streaming.
- If you see “Could not connect to RHX TCP server”, open the Remote Control GUI in RHX and enable both servers.
- Install GUI dependencies if you see backend errors: pip install 'python-intan[gui]'
or install manually:
pip install PyQt5
